

Focus: Creating charts, graphs, dashboards, infographics, and other visual representations of data.
Responsibilities
- Maintain color contrast ratios by testing color palettes and areas where differing colors provide overlap.
- Integrate accessibility checks during design, development, and other pre-publication phases of data visualization.
- Provide alternative text or summaries describing chart insights. When chart data is too much detail to put into alt text or summarize, provide a table alternative to present the data.
- Use labels, markers, and patterns—not color alone—to convey meaning.
- Make sure visuals remain clear when resized, zoomed, or viewed on mobile.
- Ensure interactive dashboards support keyboard navigation.
- Provide clear axis labels, chart titles, and legends.
- Test filtering and sorting interactions with assistive technologies.
- Test keyboard-only navigation and ensure there are no traps or dead ends.

Relevant WCAG 2.1 new success criteria
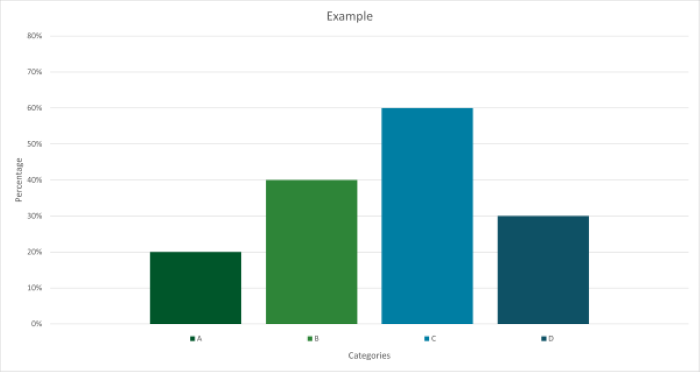
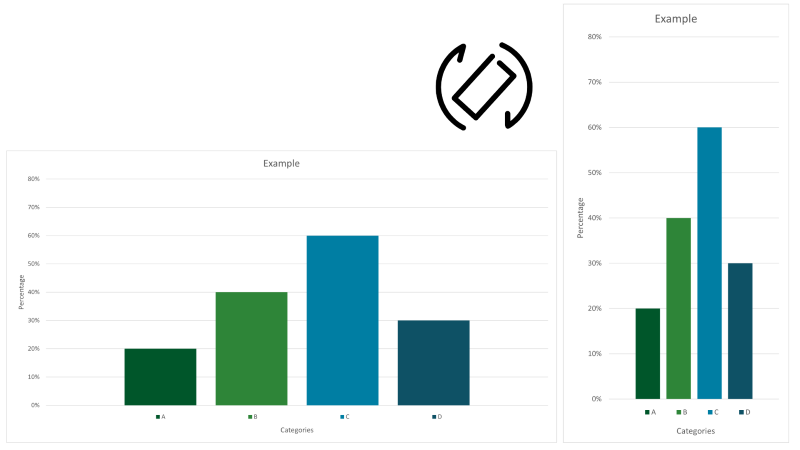
The success criteria states that content does not restrict its view and operation to a single display orientation, such as portrait or landscape, unless a specific display orientation is essential.
Note: Examples where a particular display orientation may be essential are a bank check, a piano application, slides for a projector or television, or virtual reality content where content is not necessarily restricted to landscape or portrait display orientation.
Key takeaway: Content must not lock orientation. Users should be able to view visualizations in either portrait or landscape unless essential.
Sufficient techniques:
How it applies to data visualization
- Ensure data dashboards can reflow or reorganize when switching between portrait and landscape.
- Avoid creating visuals that are cut off or unreadable in portrait mode.
- Reconfigure legends, labels, and filters to adapt logically in both orientations.
- Test mobile views of charts and maps, ensuring readability and accessibility.
Orientation failure
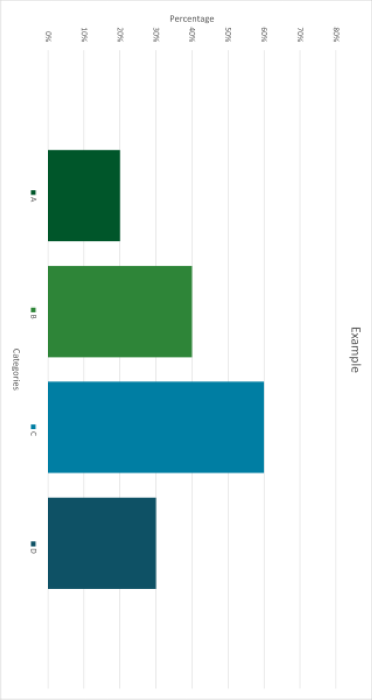
Orientation success
The success criteria states that content can be presented without loss of information or functionality, and without requiring scrolling in two dimensions for:
- Vertical scrolling content at a width equivalent to 320 CSS pixels;
- Horizontal scrolling content at a height equivalent to 256 CSS pixels.
Except for parts of the content which require two-dimensional layout for usage or meaning.
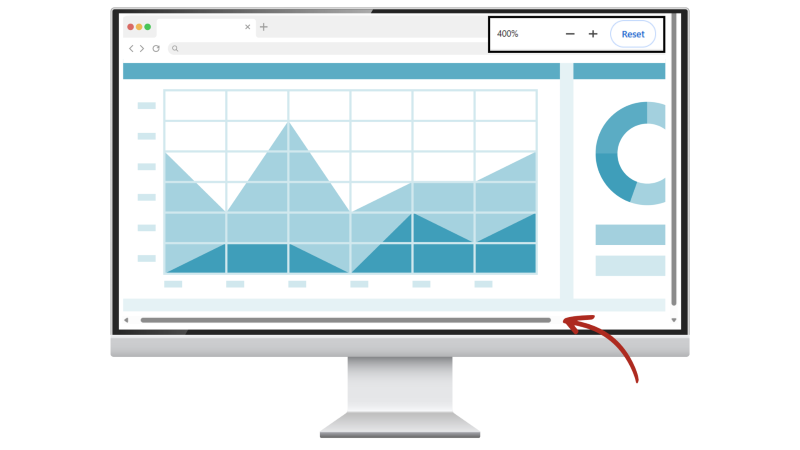
Key takeaway: Charts, maps, dashboards, etc. must adapt to narrow or zoomed screens without losing functionality (no horizontal scrolling).
Sufficient techniques
- Using media queries and grid CSS to reflow columns
- Using CSS Flexbox to reflow content
- Allowing for reflow with long URLs and strings of text
- Using CSS width, max-width and flexbox to fit labels and inputs
- Calculating size and position in a way that scales with text size
How it applies to data visualization
- Design responsive layouts that stack elements.
- Ensure legends rewrap or convert to dropdowns when space is limited.
- Avoid static-width visuals that crop important data.
- Dashboard panels should reorganize logically (e.g., filters move above the visual).
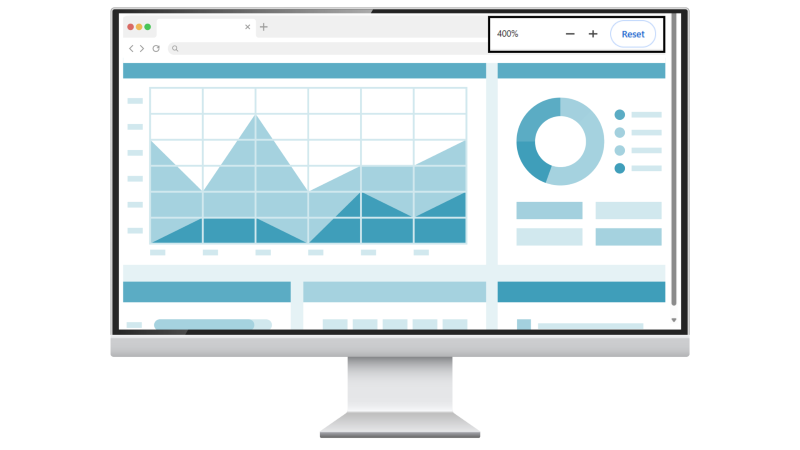
Reflow failure (horizontal scrolling required)
Reflow success (no horizontal scrolling)
Tools
- Manually test by using browser zoom to 400%.
The success criteria states that the visual presentation of the following have a contrast ratio of at least 3:1 against adjacent color(s):
- User Interface Components: Visual information required to identify user interface components and states, except for inactive components or where the appearance of the component is determined by the user agent and not modified by the author;
- Graphical Objects: Parts of graphics required to understand the content, except when a particular presentation of graphics is essential to the information being conveyed.
Key takeaway: Non-text elements (such as icons, charts, graphs, diagrams, data points) must be visually recognizable. For data visualization roles, this is critical. Poor contrast can make datasets unreadable for low-vision users.
Sufficient techniques
- For user interface components:
- For graphical content:
How it applies to data visualization
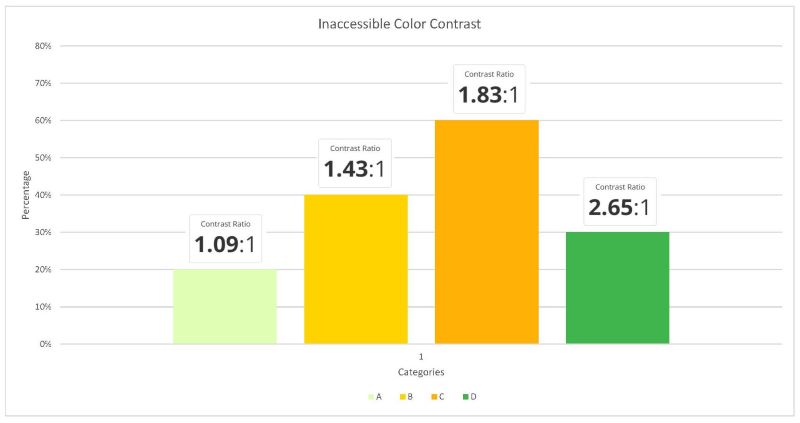
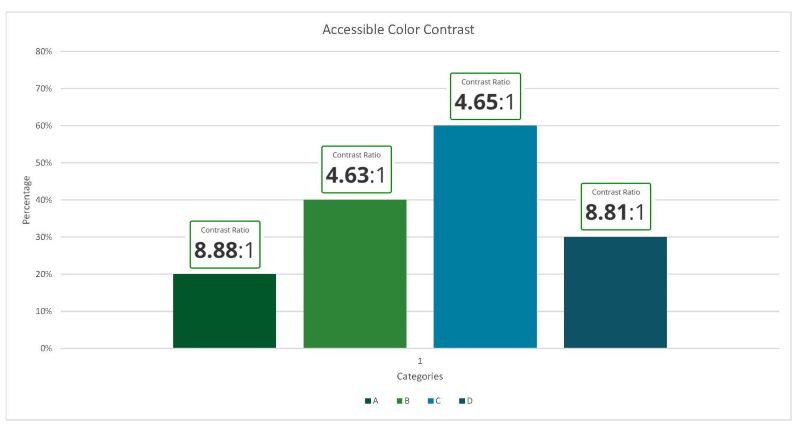
- When selecting color palettes, make sure that each data series meets the 3:1 contrast ratio relative to its background and adjacent elements.
- Avoid relying only on faint color differences to differentiate series — use patterns, markers, shapes, and outlines.
- Ensure legend keys match the same contrast level as the data in the visual.
- Add borders or outlines around low-contrast elements when necessary (e.g., pastel bars).
- When exporting visuals (PNG, SVG, embed), check that contrast hasn’t been reduced due to compression or theme settings.
- Provide alternatives for complex visuals, such as:
- Descriptive summaries
- Downloadable data tables
- Text alternatives for key insights
Graph color contrast failure
Graph color contrast success
Tools
Examples of graphics the success criterion applies to
Icons, graphs, diagrams, and infographics are examples of graphic objects that are composed of lines or shapes and a limited color palette over which the content author has creative control. Designers should ensure that these graphics conveying important information have a 3:1 contrast ratio against the background.
Note: Not every graphical object needs to contrast with its surroundings; only those that are required for a user to understand what the graphic is conveying.
Exceptions
- If a graphic contains text that is embedded or overlayed and conveys the same information. An example would be the labels and values on a bar graph.
- The graphic does not convey any meaningful information and is for decorative purposes only.
- The information is available in another form.
- The graphic is part of a logo or brand name.
The success criteria states that in content implemented using markup languages that support the following text style properties, no loss of content or functionality occurs by setting all of the following and by changing no other style property:
- Line height (line spacing) to at least 1.5 times the font size;
- Spacing following paragraphs to at least 2 times the font size;
- Letter spacing (tracking) to at least 0.12 times the font size;
- Word spacing to at least 0.16 times the font size.
Exception: Human languages and scripts that do not make use of one or more of these text style properties in written text can conform using only the properties that exist for that combination of language and script.
Key takeaway: Text inside data visuals (such as axis labels, legends, annotation notes, pop-ups) must remain readable and not overlap. Users must be able to increase text spacing without breaking the layout.
Sufficient techniques
How it applies to data visualization
- Ensure labels don’t collide when line height increases.
- Use layout-safe text placement; avoid pixel-perfect positioned labels.
- Avoid embedding text in images, always use real text.
Text spacing failure
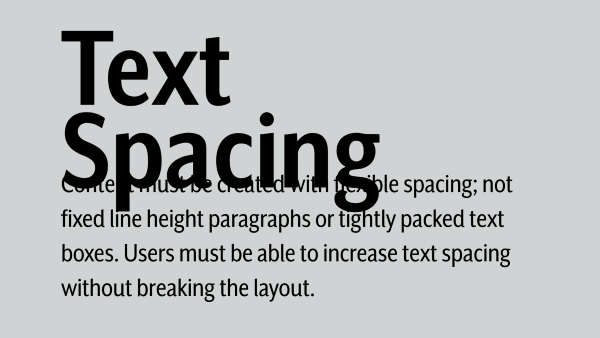
Text spacing success
The success criteria states where receiving and then removing pointer hover or keyboard focus triggers additional content to become visible and then hidden, the following are true:
- Dismissible: A mechanism is available to dismiss the additional content without moving pointer hover or keyboard focus, unless the additional content communicates an input error or does not obscure or replace other content;
- Hoverable: If pointer hover can trigger the additional content, then the pointer can be moved over the additional content without the additional content disappearing;
- Persistent: The additional content remains visible until the hover or focus trigger is removed, the user dismisses it, or its information is no longer valid.
Exception: The visual presentation of the additional content is controlled by the user agent and is not modified by the author.
Key takeaway: When additional content appears on hover or focus, it must remain visible when the pointer is over it, not disappear immediately when moving to the tooltip, and be dismissible.
Sufficient techniques
How it applies to data visualization
- Ensure tooltips and pop-ups remain open long enough for reading.
- Enable keyboard access to tooltip-triggered insights.
- Avoid hover-only access — provide click or focus equivalents.
Tools
- Manually test the component with keyboard navigation (Tab / Shift+Tab)
The success criteria states that all functionality that uses multipoint or path-based gestures for operation can be operated with a single pointer without a path-based gesture, unless a multipoint or path-based gesture is essential.
Note: This requirement applies to web content that interprets pointer actions (i.e., this does not apply to actions that are required to operate the user agent or assistive technology).
Key takeaway: Charts, maps, dashboards must not rely on multi-touch gestures for essential interactions.
Sufficient techniques
- Providing controls to achieve the same result as path based or multipoint gestures
- Providing single point activation for a control slider
How it applies to data visualization
- Most data visualizations can be accomplished with simple gestures. There are some instances that may require complex actions like pinch, rotate, or two-finger pan that must have a simple pointer alternative.
- Example: A map requires holding down the Control key to make multiple selections using a mouse.
- A solution could be making a pre-set group of points that can be selected with a filter, such as a group of places on a map.
The success criteria states that for functionality that can be operated using a single pointer, at least one of the following is true:
- No Down-Event:The down-event of the pointer is not used to execute any part of the function;
- Abort or Undo:Completion of the function is on the up-event, and a mechanism is available to abort the function before completion or to undo the function after completion;
- Up Reversal:The up-event reverses any outcome of the preceding down-event;
- Essential:Completing the function on the down-event is essential.
Key takeaway: Users must be able to cancel or avoid accidental activation of touch interactions. A tap should not trigger immediate irreversible action on a chart or map.
Sufficient techniques
- Ensuring that drag-and-drop actions can be cancelled
- Using native controls to ensure functionality is triggered on the up-event
How it applies to data visualization
- Allow users to review and confirm their action before critical information is submitted.
- Prevent accidental activation when dragging or touching data points.
The success criteria states that for user interface components with labels that include text or images of text, the name contains the text that is presented visually.
Note: A best practice is to have the text of the label at the start of the name.
Key takeaway: The visible text label must match the accessible name used by assistive technologies. This includes buttons, toggles, legends, filters, and map tools.
Sufficient techniques
- Including the text of the visible label as part of the accessible name
- Matching the accessible name to the visible label
How it applies to data visualization
- Legends must match their spoken names for people relying on voice recognition software to access and use controls such as buttons, drop-down menus, check boxes, and filters.
- Example: If the visible text on a drop-down menu says “Filter,” the accessible name should also be “Filter” and not “Refine Results.”
Correct HTML
<label for=”filters”>Filters</label>
<select id=”filters” name=”filters”>
Incorrect HTML:
<label for=”filters”>Filters</label>
<select id=”filters” name=”Refine Results”>
The success criteria states that if a keyboard shortcut is implemented in content using only letter (including upper- and lower-case letters), punctuation, number, or symbol characters, then at least one of the following is true:
- Turn off: A mechanism is available to turn the shortcut off;
- Remap: A mechanism is available to remap the shortcut to include one or more non-printable keyboard keys (e.g., Ctrl, Alt);
- Active only on focus: The keyboard shortcut for a user interface component is only active when that component has focus.
Key takeaway: Single-character keyboard shortcuts must be reversible or only work when an element has focus.
Sufficient techniques
How it applies to data visualization
- Make sure character-only shortcut keys can be turned off/modified using one or more modifier keys.
- Scope shortcuts to focused elements only.
- Avoid single-key shortcuts in dashboards that could accidentally trigger view changes or filters.
- Allow users to turn off or remap shortcuts in interactive visual tools.
- Make shortcuts active only when the relevant chart or control is focused.
Tools
- Test different devices and assistive technologies to check for any accidental keyboard shortcut triggers.
The success criteria states that functionality that can be operated by device motion or user motion can also be operated by user interface components and responding to the motion can be disabled to prevent accidental actuation, except when:
- Supported Interface: The motion is used to operate functionality through an accessibility supported interface;
- Essential: The motion is essential for the function and doing so would invalidate the activity.
Key takeaway: If content uses device motion for interactions (such as shaking, tilting, rotating, etc.), users must have non-motion alternatives and be able to turn off motion controls.
Sufficient techniques
How it applies to data visualization
- Avoid including interactive effects or experiences that require users to move their device unless there is also a simple tap option.
- Ensure that all users can participate in interactive content, including people who cannot physically move their device or who have motion sensitivity.
- Don’t depend on shaking or tilting gestures to trigger visualizations or filters.
- Provide non-motion alternatives for any interactions tied to device movement.
